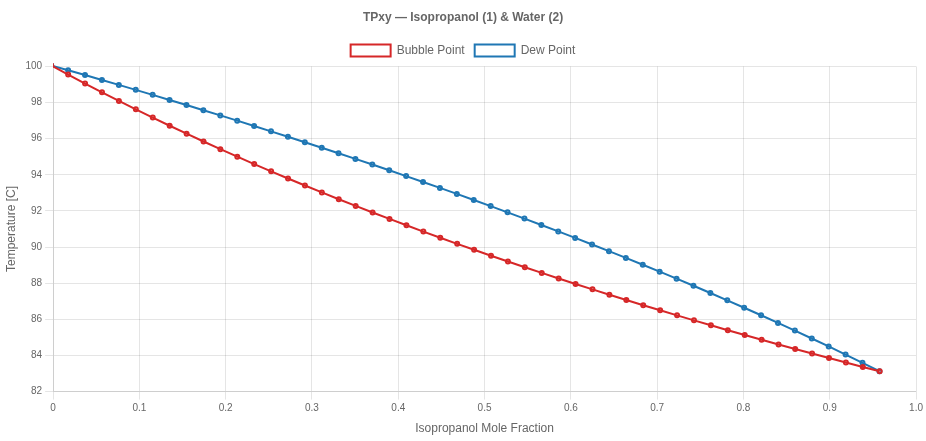
What this tool does
- Plots T-x-y diagrams at constant pressure (the most common case for distillation design).
- Plots P-x-y diagrams at constant temperature (useful for VLE at non-ambient conditions).
- Supports any binary pair from the ChemForge thermodynamic database.
- Reads off bubble and dew curves with a hover-tracer that interpolates between calculated points.
- Exports the underlying x, y, Tbubble, Tdew arrays as CSV.
- Drop the diagram into a larger flowsheet — it's a real unit operation, not a one-off plot.
Property packages supported
The right thermo model depends on the system. The tool exposes ChemForge's full property-package suite:
- NRTL — strongly non-ideal liquids (alcohols, water mixtures, organic acids). Captures both minimum- and maximum-boiling azeotropes.
- UNIQUAC — similar coverage to NRTL, often with smoother extrapolation.
- Wilson — completely miscible liquids only (cannot represent LLE).
- Peng-Robinson / SRK — hydrocarbons, light gases, and high-pressure systems. The default for refinery work.
- Ideal — Raoult's law. Useful as a sanity check; rarely correct for real mixtures.
Why ChemForge for VLE
Most browser-based VLE calculators stop at Raoult's law or hard-code a single binary pair. ChemForge ships with vetted binary interaction parameters, so the azeotropes appear where they actually are — not where ideal mixing predicts them.
And the diagram is a real flowsheet object. Once you've validated the phase behavior, drop a flash drum, an absorber, or a distillation column onto the same components and run the full simulation. No re-entering data, no exporting to a different tool.
Worked examples to start from
Isopropanol–Water (NRTL)
The canonical NRTL teaching case. The azeotrope sits at roughly 87 mol% IPA at 1 atm.
Maximum-boiling azeotropeAcetone–Chloroform (NRTL)
Negative deviation from Raoult's law — uncommon, instructive, and a great NRTL stress test.
How the calculation works
For each composition slice between x = 0 and x = 1, ChemForge runs an isobaric (T-x-y) or isothermal (P-x-y) flash and stores the bubble and dew points. With NRTL or UNIQUAC selected, activity coefficients are evaluated from binary parameters in the component database. With Peng-Robinson or SRK, the cubic EOS is used with classical mixing rules.
The flash is the same engine that powers the Flash Drum, Distillation Column, and Absorber unit operations in ChemForge — so the diagram you see is consistent with whatever flowsheet you build next.
Frequently asked
Does it cost anything?
Where does the component data come from?
Can I export the diagram?
Does it handle systems with three or more components?
What's the largest pressure / temperature range it handles?
Ready to plot a diagram?
Launch the workbench with the isopropanol–water example pre-loaded. From there, swap components, change P or T, and the diagram re-renders.
Open the VLE workbench